The subject of logistics is not one that often reaches the uppermost levels of business media headlines. But, in the current international atmosphere of supply chain troubles and widespread shipping congestion, the topic is a timely one.
One result of the current surge in interest in logistics includes potential solutions and workarounds for all the latest snafus, blockages, holdups, and delays in the movement of huge amounts of goods across oceans. What are the most cost-efficient techniques for beating the shipping logjam at its own game?
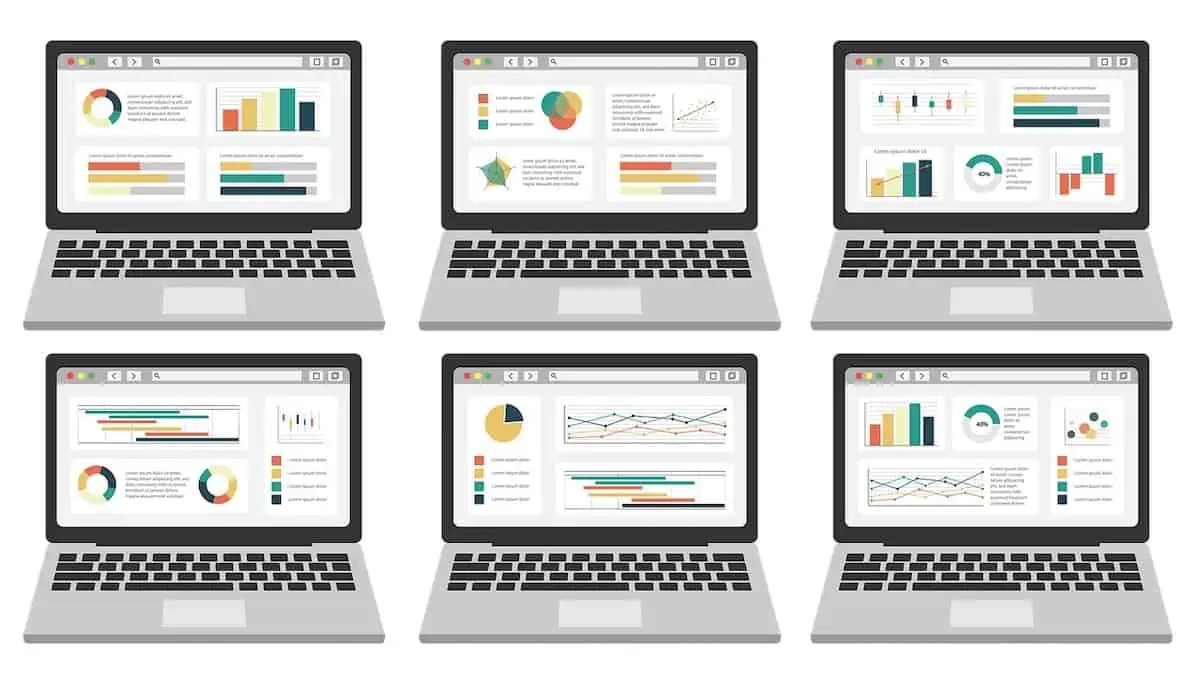
Fortunately, the newest versions of analytics or big data are already demonstrating their potential for helping move merchandise and raw materials from Point A to Point B, wherever those points happen to be. Owners and managers are leveraging the power of massive datasets in areas as varied as warehousing and visual-based analytics to speed up the transport of commercial products.
Other applications include strategic planning, multiple kinds of maintenance, the collection of accurate physical addresses, operational planning, last-mile solutions, cargo tracking, better customer service, management of perishable inventory, route optimization, and many more.
Consider the following real-life applications of how modern businesses employ advanced analytical solutions to navigate the daily challenges of supply chain logistics.
Visual Analytics
Analysis rooted in any kind of visual presentation, hard copy or computer-based, is the essence of visual analytics. Many types of companies use real time analytics in the same way weather forecasters collect various statistics to produce a reliable guess about tomorrow’s chance of rainfall.
In a similar way, gamblers amass team and player stats to set odds about the results of next week’s sports contests. Recently, visual analytics has been building a large following among managers, entrepreneurs, politicians, and medical professionals.
The reason is simple in that human beings are more apt to understand concepts presented in visually analytical formats than written, textual ones. Visual analytics is, of course, a cousin of the beloved business practice of data visualization, but it goes further because it’s not just the final output but the whole process of creating the estimates, forecasts, and predictions in the first place. It’s no exaggeration to say that almost every field of commercial business can benefit from visual analytics.
Tracking
When it comes to visibility on a particular route, no matter the location of the supply chain, analysis of big datasets offers significant advantages over traditional tracking practices. One of the perks of the newest systems is that both buyers and sellers can receive timely email or text updates at any point in a delivery route. That includes letting all parties know about slowdowns, stoppages, or any other kind of congestion in the chain.
How is it done? Businesses that transport goods employ a number of tactics, including barcodes, GPS-enabled scanners, product tags that offer RFID technology, as well as a host of techniques that have the ability to pinpoint the locations of merchandise 24/7. In most cases, the wealth of automation works to the advantage of both sellers and buyers by moving products faster and at a lower overall cost.
Perishables
All categories of perishables, not all of which are food items, present special challenges for businesses that sell them. For one thing, most retailers that offer perishable products, like fresh vegetables, do not enjoy the luxury of operating with large profit margins. In fact, narrow margins have long been a main feature of the grocery segment.
One result is that sellers must be particularly careful about inventory levels of anything that has a potentially high spoilage rate. Apples, lettuce, bread, and milk are common members of this grouping. There is no more time-sensitive category of commercial goods than perishables.
Time not only leads to spoilage but can also cause dangerous forms of biological contamination that have the potential to invite legal action from ill customers. For most merchants in this sector, the solution includes meticulous attention to barcodes and techniques that can assess the rate of spoilage or decay at any point in a particular route. That way, sellers can discover potential contamination and product quality issues even before the goods arrive on their loading docks.
Routes
There’s much more to route optimization than meets the eye. In fact, the challenge is perhaps the single biggest management hurdle in the transport industry. Because there are dozens, sometimes hundreds, of possible scenarios for any given shipment, even the most routine errors can lead to huge routing problems. The result of everyday mistakes can lead to high expenses and lower profits.
What’s the answer? For many businesses, it’s big data and the many tools of analytical application. Routing experts rely on traffic patterns, reams of shipping information, regional climate forecasts, and other parameters to construct the most cost-efficient route for a given load. While shortest does not always translate to cheapest, it is often the case that merchants can and do save money by avoiding long routes.

